Thursday, February 11, 2021

LIKE predicate hidden conversion

 There is one gotcha with LIKE predicate, which I recently discovered. It caused me quite a lot of confusion, so I'll describe it here to hopefully save others this headache.

First let's set up a table and fill it with data:

CREATE TABLE T
(
	[TextColumn] [varchar](100) NOT NULL
)

CREATE NONCLUSTERED INDEX [IX_TextColumn] ON T
(
	[TextColumn] ASC
)


;WITH cte AS (
SELECT a FROM (VALUES('A'),('B'),('C'),('D'),('E'),('F')) x(a))
INSERT INTO T
SELECT cte.a FROM cte
CROSS JOIN cte cte2
CROSS JOIN cte cte3
CROSS JOIN cte cte4
CROSS JOIN cte cte5
CROSS JOIN cte cte6
CROSS JOIN cte cte7
CROSS JOIN cte cte8
CROSS JOIN cte cte9

Now let's run following query and check its execution plan. Note: I'm using variable here, but the same issue happens with parameters

DECLARE @v NVARCHAR(4000) = N'C'

SELECT COUNT(1) FROM dbo.T
WHERE  TextColumn LIKE @v


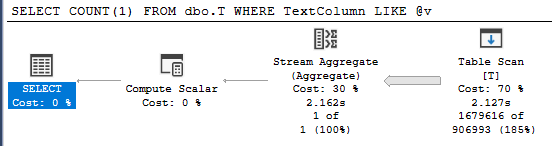
As we see, we've got table scan even though there is perfectly valid index for this query. So why isn't it used? Let's examine the table scan closer:


As we can see there is implicit conversion from NVARCHAR variable to match VARCHAR column. Meaning the predicate is not SARGable. Now that we know the issue there are few possible fixes:
  • change the variable to VARCHAR
  • add OPTION(RECOMPILE) to the query
  • explicitly cast the variable to VARCHAR
In all of the above cases you will end up with nice, quick seek:


Now you may wonder why I found this confusing. There are three reasons:
  1. Normally when there is implicit conversion happening, the SELECT node has yellow warning mark. The issue is easily noticeable. Not in this case. 
  2. It doesn't happen when you swap the datatypes (column nvarchar, variable varchar)
  3. The same problem doesn't happen with equality comparison is used:


This issue can become quite problematic when working with NHibernate and probably other frameworks. NHibernate doesn't emit VARCHAR parameters, only NVARCHAR. So if you have VARCHAR columns in your database and you want to filter on them using LIKE keyword you can be unpleasantly surprised performance wise.

Sunday, April 12, 2020

Join on nullable column

There is a interesting behavior I noticed in SQL Server. Let me show it to you.

First let's prepare tables and data:

CREATE TABLE T1 (A UNIQUEIDENTIFIER);
CREATE TABLE T2 (A UNIQUEIDENTIFIER);

;WITH CTE AS ( SELECT A FROM (VALUES (1), (2), (3), (4), (5), (6), (7), (8)) X(A) )
INSERT INTO T1
SELECT NEWID() FROM CTE AS CTE1
CROSS JOIN CTE AS CTE2
CROSS JOIN CTE AS CTE3
CROSS JOIN CTE AS CTE4
CROSS JOIN CTE AS CTE5
CROSS JOIN CTE AS CTE6
CROSS JOIN CTE AS CTE7
CROSS JOIN CTE AS CTE8;

INSERT INTO T2
SELECT TOP 5 PERCENT A FROM T1
UNION ALL
SELECT TOP 95 PERCENT NULL FROM T1;

We have now two tables with similar number of rows. The difference is that the second one has mostly NULL values. Now let's try joining those two tables together:

SELECT COUNT(1)
FROM T1
INNER JOIN T2 ON T1.A = T2.A;

It takes 6922 ms on my machine. If you look at the execution plan, you will notice that SQL Server reads the whole T2 table, does aggregate on it and then performs a hash join.


The aggregate is useful, because it removes all the duplicate NULL values. But we're doing a inner join. Which means we cannot join on NULL value. We could simply filter these out. Let's try this:

SELECT COUNT(1)
FROM T1
INNER JOIN T2 ON T1.A = T2.A
WHERE T2.A IS NOT NULL;

This takes 4625 ms and gives the same result. In the execution plan you can observe that the aggregate is gone and we have residual predicate on T2, which removes all the unnecessary NULL values.

In conclusion we see that SQL Server could not filter out NULL values early unless explicitly told to do so. I think the reason for this is that adding such filter is rarely beneficial. So no one coded this optimization into the query optimizer. I personally encounter queries like the one above very rarely. Like once a year maybe. You can even see that the set up for this to surface is very specific. For this reason it makes no sense to go and add to every query with inner join a NOT NULL filter. It's just something to keep in mind.

Sunday, April 5, 2020

Filtering on one column and joining on another - estimate problem

Let me show you a case where SQL Server has problems with cardinality estimation and how to fix it.

First let us prepare tables and data:

CREATE TABLE T1 ( A INT, B INT)
CREATE TABLE T2 ( A INT, B INT)
GO

INSERT INTO T1 VALUES (1, 1)
GO 1000

UPDATE TOP (100) T1 SET A = 2

INSERT INTO T2 VALUES (1, 1), (2, 2)

UPDATE STATISTICS T1
UPDATE STATISTICS T2


Now try the following query and examine the execution plan:

SELECT COUNT (1) FROM T1
INNER JOIN T2 ON T1.A = T2.A
WHERE T2.B = 1

The initial execution plan

As we can see the estimates on the join are wrong. Reason for this is that we filter on column B in table T2, but use column A to join with the other table. In that case SQL Server has no idea what value will column A be. So it guesses an average. In this case the guess is far off, since the data in column A in table T1 is skewed.

How to fix this? As we can see the problem is with wrong estimates. We need to help SQL Server here and create filtered statistics:

CREATE STATISTICS S1 ON T2(A) WHERE B = 1

This statistics is on the join column and the filter is exactly the same. The execution plan estimates look much better now:
The better execution plan

In this simplistic example it doesn't matter much. Yet I encountered cases where this caused hash spills. In addition, if it's executed often, you can get significant performance problems.

Now this is in no way universal fix. It will work only if filter on B doesn't change. If we change the where clause to B = 2, the statistics will be wrong again. We would need to create new statistics for the new where clause. This is not scalable. It may be doable for 5 values, but not for 10 000. Yet this trick may come in helpful from time to time.

Monday, November 4, 2019

Tracking query timeouts with extended events

Timeouts are kind of a blind spot for performance tuner. They don't appear in any DMVs like other queries. You get to know about them either when someone points them out for you or from application logs, if you have such logging in place. For this reason I wanted independent way of tracking timeouts. After quite exhaustive research I figured out how to do this with Extended Events. Turns out that when application cancels request, it's result is 2. Theoretically you could use attention event, but I found it reported timeouts on statements, which didn't from application point of view. Here's the event definition:

CREATE EVENT SESSION [QueryTimeouts] ON SERVER 
ADD EVENT sqlserver.rpc_completed(SET collect_statement=(1)
    ACTION(sqlserver.database_name,sqlserver.username)
    WHERE ([result]=(2))),
ADD EVENT sqlserver.sql_batch_completed(
    ACTION(sqlserver.database_name,sqlserver.username)
    WHERE ([result]=(2)))
ADD TARGET package0.asynchronous_file_target
    (SET filename = 'G:\QueryTimeouts.xel', max_file_size = 5, max_rollover_files = 2)
WITH (MAX_MEMORY=4096 KB,EVENT_RETENTION_MODE=ALLOW_SINGLE_EVENT_LOSS,MAX_DISPATCH_LATENCY=30 SECONDS)

The data can be extracted with following query:

DECLARE @filename NVARCHAR(max)
SELECT @filename = REPLACE(CAST(sesf.value AS NVARCHAR(MAX)), '.xel', '') 
FROM sys.server_event_session_fields sesf
JOIN sys.server_event_sessions ses ON ses.event_session_id = sesf.event_session_id
WHERE sesf.name = 'filename'
AND ses.name = 'QueryTimeouts'

;WITH cte
AS (SELECT CONVERT(XML, event_data) ed
    FROM sys.fn_xe_file_target_read_file(@filename + '*.xel', NULL, NULL, NULL) )
SELECT
	DATEADD(mi, DATEDIFF(mi, GETUTCDATE(), GETDATE()), ed.value('(event/@timestamp)[1]', 'datetime2(3)')) AS [timestamp],
	ed.value('(event/action[@name="database_name"]/value)[1]', 'nvarchar(128)') AS [database_name],
	ed.value('(event/action[@name="username"]/value)[1]', 'nvarchar(128)') AS username,
	ed.value('(event/data[@name="duration"]/value)[1]', 'bigint')/1000 AS duration,
	ed.value('(event/data[@name="cpu_time"]/value)[1]', 'bigint')/1000 AS cpu_time,
	ed.value('(event/data[@name="logical_reads"]/value)[1]', 'bigint') AS logical_reads,
	ISNULL(ed.value('(event/data[@name="spills"]/value)[1]', 'bigint'),0) AS spills,
	ISNULL(ed.value('(event/data[@name="batch_text"]/value)[1]', 'nvarchar(max)'),ed.value('(event/data[@name="statement"]/value)[1]', 'nvarchar(max)')) AS text
FROM cte
ORDER BY timestamp;

There are few gotchas when using this event. First you want to filter out non application users like yourself. You'll be surprised how often you cancel your queries. Secondly, some applications are not written very well. They do select without TOP XX clause but cancel the query after receiving some number of rows. Better filter those out. Either in the event itself or when extracting data.

When analyzing the results I compare duration and CPU time. If they are similar then the query is probably too slow. If the times are like 30 seconds duration but 1 for CPU, then it was probably blocked by other query. You need to use other methods to identify the offending query. I also check spills. They can be slow, so fixing them may speed up the query. Note that spills are only reported for batches for some reason.

Thursday, October 10, 2019

Search plan cache for index

Quite often I want to see where specific index is used. I started by using script from Jonathan Kehayias. Sadly his script took around 10 minutes on plan cache of 15 GB size. Also it produced many duplicate entries. So I tweaked his script to my needs. My version groups results by plan hash. This helps, if you have unparametrized queries. I also switched to exist() when searching xml. Finally I use both dm_exec_query_plan and dm_exec_text_query_plan. For some reason, during my testing, it turned out quicker than with only one of them. dm_exec_text_query_plan lets you limit execution plan only to specific query using index of your interest, in case a batch or stored procedure has more than one statement. That way you don't need to analyze the whole thing to find the relevant part.

Here's the code:

SET TRANSACTION ISOLATION LEVEL READ UNCOMMITTED;
DECLARE @IndexName AS NVARCHAR(128) = N'YourIndexName';

--Handle the case where the left or right was quoted manually but not the opposite side 
IF LEFT(@IndexName, 1) <> '[' SET @IndexName = '[' + @IndexName;
IF RIGHT(@IndexName, 1) <> ']' SET @IndexName = @IndexName + ']';

;WITH XMLNAMESPACES (DEFAULT 'http://schemas.microsoft.com/sqlserver/2004/07/showplan')
, cte AS
	(SELECT plan_handle, query_plan_hash, statement_start_offset, statement_end_offset,
		MIN(creation_time) OVER(PARTITION BY qs.query_plan_hash ORDER BY qs.query_plan_hash) creation_time,
		MAX(last_execution_time) OVER(PARTITION BY qs.query_plan_hash ORDER BY qs.query_plan_hash) last_execution_time,
        SUM(total_worker_time) OVER(PARTITION BY qs.query_plan_hash ORDER BY qs.query_plan_hash) total_worker_time,
		SUM(total_logical_reads) OVER(PARTITION BY qs.query_plan_hash ORDER BY qs.query_plan_hash) total_logical_reads,
		SUM(execution_count) OVER(PARTITION BY qs.query_plan_hash ORDER BY qs.query_plan_hash) execution_count,
		ROW_NUMBER() OVER(PARTITION BY qs.query_plan_hash ORDER BY qs.query_plan_hash) row_num
    FROM sys.dm_exec_query_stats AS qs
   )
, cte2 AS
	(SELECT * FROM cte
	OUTER APPLY sys.dm_exec_query_plan(cte.plan_handle) AS qp
	WHERE (query_plan.exist('//IndexScan[not(@Lookup)]/Object[@Index=sql:variable("@IndexName")]') = 1 OR query_plan IS NULL) AND  cte.row_num = 1
	)
, cte3 AS
	(SELECT ISNULL(
			SUBSTRING(qt.text, (cte2.statement_start_offset / 2) + 1, ((CASE cte2.statement_end_offset WHEN -1 THEN DATALENGTH(qt.text) ELSE cte2.statement_end_offset
						END - cte2.statement_start_offset) / 2) + 1), qt.text) AS TSQL,
		TRY_CAST(qp.query_plan AS XML) query_plan, cte2.creation_time, cte2.last_execution_time,
		cte2.total_worker_time, cte2.total_logical_reads, cte2.execution_count
    FROM cte2
    CROSS APPLY sys.dm_exec_text_query_plan(cte2.plan_handle, cte2.statement_start_offset, cte2.statement_end_offset) AS qp
    CROSS APPLY sys.dm_exec_sql_text(cte2.plan_handle) AS qt)
SELECT *
FROM cte3
WHERE query_plan.exist('//IndexScan[not(@Lookup)]/Object[@Index=sql:variable("@IndexName")]') = 1
ORDER BY cte3.execution_count DESC
OPTION (RECOMPILE);

I admit it's quite messy, but gets me relatively clean data and runs in 2 minutes. Quite nice improvement over original.

Before using this script three warnings:
  1. Remember that plan cache doesn't necessary hold all execution plans, especially after instance restart
  2. This script won't catch index usage, if plan is not parse-able as XML.
  3. Considering the above be careful when performing index maintenance based on script results.

Sunday, September 22, 2019

Update on a view with NULL column

Let's set up a experiment:

CREATE TABLE T 
(
	c1 INT,
	c2 DATETIME2
);

GO

INSERT INTO T
VALUES (1, GETUTCDATE());

GO

CREATE VIEW V AS
SELECT c1, NULL as c2 FROM T;

GO

CREATE TRIGGER VT on V 
INSTEAD OF UPDATE AS

	UPDATE V SET c1 = 1
	FROM V JOIN inserted AS i ON V.c1 = i.c1

GO

Now assume you want to run an update statement through the view and for some reason you want to update in your statement column c2 (Yes I agree this isn't very sensible thing you might want to do).

UPDATE V SET c2 = GETUTCDATE()
WHERE c1 = 1

This fails with error:
Implicit conversion from data type datetime to int is not allowed. Use the CONVERT function to run this query.

How to workaround this? Well the solution is suggested by error message. It seems NULL is interpreted as integer by default. You need to cast this NULL in view to proper data type:

ALTER VIEW V AS
SELECT c1, CAST(NULL AS DATETIME2) AS c2
FROM T

Now the above update will be successful.

Normally you shouldn't have constant columns in a view, which your code tries to update or insert into. Yet I had such situation and I am sure this can happen to others. That's why I wanted to document this peculiarity.

Sunday, August 25, 2019

Who is doing all those batch requests anyway?

Let's say you have a instance which has normally 1000 batch requests/s. Then suddenly it's 10 times more batch requests. It doesn't even need to affect performance in visible way. Yet it's is a sign that something is going wrong somewhere. In case you have many applications, each connecting through different user, you can try to pinpoint which one is it. To do this you can set up such extended event:

CREATE EVENT SESSION NumberOfStatementsByUser ON SERVER 
ADD EVENT sqlserver.sql_batch_completed(
    ACTION(sqlserver.username))
, ADD EVENT sqlserver.rpc_completed(
    ACTION(sqlserver.username))
ADD TARGET package0.histogram(SET source=N'sqlserver.username')
WITH (MAX_MEMORY=4096 KB, EVENT_RETENTION_MODE=ALLOW_SINGLE_EVENT_LOSS, 
        MAX_DISPATCH_LATENCY=30 SECONDS,MAX_EVENT_SIZE=0 KB,
        MEMORY_PARTITION_MODE=NONE,TRACK_CAUSALITY=OFF, STARTUP_STATE=OFF)

After starting it, you can check which user starts most requests with following query:

;WITH
	sql_batch_completed_by_database AS ( 
        SELECT CAST(xet.target_data AS xml) AS event_data
        FROM sys.dm_xe_session_targets AS xet  
        JOIN sys.dm_xe_sessions AS xe  
            ON (xe.address = xet.event_session_address)  
        WHERE xe.name = 'NumberOfStatementsByUser'
    )
    , requests_by_user AS (
        SELECT
              slot.value('(./value)[1]', 'sysname') AS Username
            , slot.value('@count', 'bigint') AS RequestCount
        FROM (SELECT event_data FROM sql_batch_completed_by_database) AS xe(event_data)
        CROSS APPLY event_data.nodes('/HistogramTarget/Slot') AS histogram_target(slot)
    )
SELECT Username, SUM(RequestCount) AS RequestCount
FROM requests_by_user
GROUP BY Username;

Personally, I start this extended event only when I see a problem and only for a minute or so. This is enough to identify the troublesome user. After I identify the user, I usually set up tracing only for him to see what queries he runs. I stop the trace stop as soon as possible. The profiler is quirky and usually runs for few seconds before it can be stopped. This is enough to capture thousands of event. In my experience such things happen when the code being executed goes into infinite loop or user is missing permissions (yes this happened). Having the queries which are being executed should be sufficient information to give to people responsible for the application, so they can start troubleshooting their code.